



Introduction
Sleep is a vital psychological process that is essential for strengthening the body’s immune system, regulating circadian rhythms, and maintaining homeostasis. According to previous studies, the recommended amount of sleep for adults is 7–8 hours, which is optimal for overall health and well-being [1]. Insufficient sleep delays physical recovery, increases the risk of accidents, and is strongly associated with several chronic diseases [2,3]. A nightly sleep duration of 7–8 hours is generally considered optimal for enhancing overall health in adults [4]. Insufficient sleep reduces the body’s recovery capacity and increases accident risks and the risk of chronic disease, partly driven by systemic inflammation and impaired immune responses [5,6]. In Korea, sleep-related disorders are especially common among adults aged ≥45 years, many of whom experience symptoms, including difficulty initiating sleep, frequent nocturnal awakenings, early morning arousal, and non-restorative sleep [7]. These disturbances are frequently linked not only to aging but also to coexisting physical illnesses, psychological stressors like depression or anxiety, and oral health problems such as tooth loss or periodontal disease, which may exacerbate discomfort and systemic inflammation [8].
The masticatory system includes the teeth, mandible, craniomandibular joints, masticatory and accessory muscles, tongue, lips, cheeks, oral mucosa, and associated neural structures [9]. Masticatory dysfunction is characterized by a decline in normal chewing ability, potentially arising from structural problems, such as tooth loss, or functional impairments, including decreased bite strength [9]. Masticatory discomfort, or difficulty chewing, is common in Korea, especially among older adults. Temporomandibular dysfunction, a condition often associated with masticatory discomfort, has been increasing in Korea [10]. Impaired mastication, frequently caused by tooth loss due to periodontal disease, may be affected by underlying oral inflammation. In this context, inadequate sleep, whether too short or too long, has been associated with increased systemic inflammation and impaired immunological function [11], both of which can negatively affect periodontal health and contribute to chewing dysfunction [12]. Moreover, sleep deprivation triggers inflammatory responses and morphological changes in the masseter muscle, contributing to muscle atrophy, highlighting the crucial role of sleep in muscle metabolism as sleep disorders can lead to skeletal muscle alterations characterized by tissue atrophy [13].
Several epidemiological studies have explored the relationship between sleep disorders and oral health [14]. However, Research on the association between sleep and masticatory discomfort is limited, with no large-scale population-based studies or subgroup analyses considering lifestyle variations.
This study aimed to examine the association between sleep duration and masticatory discomfort, accounting for sociodemographic and psychological factors such as age, gender, depression, job type, marital status, and residential area.
Materials and Methods
This study was approved by the Institutional Review Board of Kyungpook National University (approval no. 2024-0227).
Data source and study population
This cross-sectional study used data from the Community Health Survey (CHS), a national household survey conducted annually by the Korea Disease Control and Prevention Agency since 2008. The CHS provides population-based health estimates to support evidencebased regional healthcare planning and employs a complex sampling design, including systematic sampling of households within clusters. Adults aged ≥19 years residing in sampled households were interviewed oneon-one by trained examiners using computer-assisted personal interviewing. The survey includes a household component (family composition and income) and an individual self-reported component covering health behaviors, physical and mental health, healthcare use, and socioeconomic factors.
This study utilized data from the 2024 CHS to investigate the associations between sleep duration, masticatory discomfort, and poor oral health. Of the 231,728 participants, those aged ≤44 years (n = 61,261), those exhibiting suicidal ideation (n = 39), daily binge drinkers (n = 5,646), participants with a history of drug abuse (n = 154), and participants with incomplete covariate data (n = 49,522) were excluded. Therefore, 155,106 participants were included in the final analysis. The requirement for written informed consent was waived because the analysis used anonymous and de-identified data. The reporting followed the Strengthening the Reporting of Observational Studies in Epidemiology (STROBE) guidelines.
Independent variable: sleep duration
Sleep duration was recorded according to responses to the following question: “How many hours do you typically sleep in a day?” It was categorized by weekday (or workday) and weekend (or non-workday, day before a non-workday) and quantified in hours. Responses given in minutes were rounded down for ≤29 minutes and rounded up for ≥30 minutes. The information was promptly reconfirmed in cases of atypical responses (0 hours or 24 hours). The average sleep duration was subsequently calculated and categorized into five groups: <5 hours, 5.0–5.9 hours, 6.0–6.9 hours, 7.0–7.9 hours, 8.0-8.9 hours, and ≥9 hours using the formula15) below.
Dependent variable: subjective masticatory discomfort and oral health status
Masticatory discomfort was assessed using the following participant-reported question: “Are you currently experiencing difficulty or discomfort while chewing food due to issues with your teeth, dentures, or gums?” The examiner clarified the extent of chewing-related discomfort, with participants using partial or complete dentures specifically asked about discomfort experienced while wearing them. Masticatory discomfort was subsequently categorized into two groups: no (including responses of ‘[very] comfortable’ and ‘fair’) and yes (including responses of ‘[very] uncomfortable’).
Subjective oral health was assessed through participants’ responses to the following question: “How do you feel about your oral health, including your teeth, gums, and overall condition?” The examiner-maintained neutrality to ensure unbiased self-assessment. Subjective oral health was subsequently categorized into two groups: good (which includes ‘[very] good’ and ‘fair’) and poor (which includes ‘[very] poor’ and ‘poor’), and was redefined as poor oral health.
Confounding variables
Sociodemographic variables included gender, age (45–64, 65–74, ≥75 years), education (<middle school, high school, ≥some college), residential area (urban, rural), income (<2, 2–3.99, 4–5.99, ≥6 million Korean Won (KRW)), job type (white-collar, blue-collar, service/sales, unemployed), and marital status (never married, married, divorced, widowed). Physical activity was classified as inactive, lightly active (walking ≥30 min/day, ≥5 days/week), moderately active (moderate activity ≥30 min/day, ≥5 days/week), or highly active (vigorous activity ≥20 min/day, ≥3 days/week). Alcohol consumption was categorized by frequency: never, once a month, 2–4 times a month, or ≥2 times weekly. Smoking status included never, former, occasional, or daily smokers. BMI was calculated from height and weight and categorized as underweight (<18.5 kg/m²), normal (18.5–22.9), overweight (23.0–24.9), or obese (≥25.0). Depression, assessed using PHQ-9, was classified as none (0), mild (5–9), moderate (10–14), moderate-to-severe (15–19), or severe (20–27). Hypertension and diabetes were based on selfreported diagnoses.
Statistical analyses
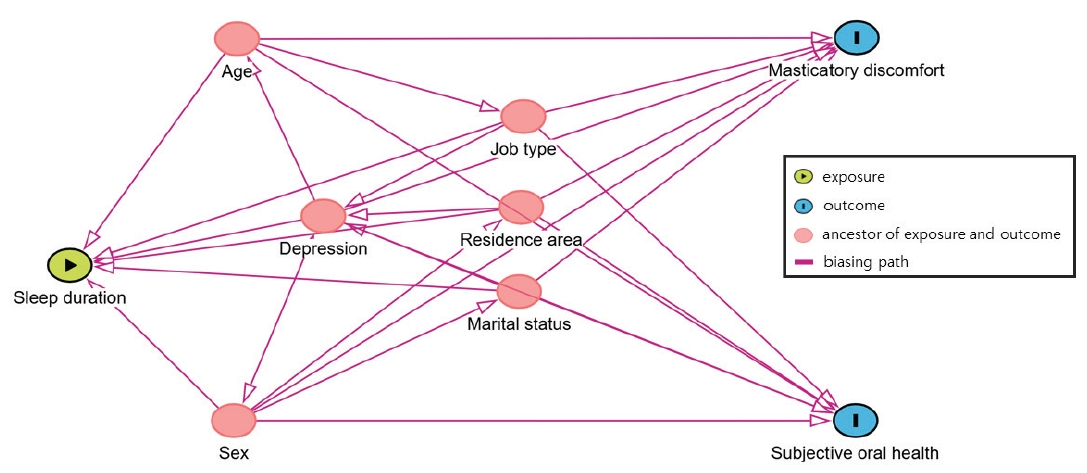
For this study, the directed acyclic graph (Fig. 1), constructed based on previous studies, illustrates a hypothetical relationship between the exposure and the outcome. All statistical analyses utilized sample weights to account for the complex survey design. Differences in covariates based on self-reported masticatory discomfort and poor oral health status were assessed using Rao–Scott adjusted chi-square tests. Our study estimated the average marginal effect (AME) of sleep duration on subjective oral health using logistic regression models, accounting for survey weights.
Multivariable logistic regression models were utilized to investigate the associations between sleep duration, masticatory discomfort, and poor oral health, estimating odds ratios (ORs) and 95% confidence intervals (CIs). Subgroup analyses were performed based on age, gender, depression status, job type, marital status, and residential area to investigate the consistency of the association. The overall model fit was assessed using McFadden’s Pseudo R-squared, which was estimated based on the quasi-loglikelihood values. The overall significance of the model was evaluated using a design-adjusted Wald F-test. To facilitate interpretation of effect sizes derived from the non-linear regression models, the Average Marginal Effects (AMEs) were calculated. Statistical analyses were conducted using R software ver. 4.4.2 (The R Foundation for Statistical Computing, Vienna, Austria) and SPSS software for Windows ver. 27.0 (IBM Corp, Armonk, NY, USA). All tests were two-sided, and p < 0.05 was considered statistically significant.
Results
A total of 155,106 participants met the inclusion criteria. Most participants were women (53.5%), aged 45–64 years (61.5%), held a college education or higher (36.3%), and reported the highest income level (≥6 million KRW; 27.8%). Overall, 41.2% of participants had a history of smoking (24.4% former, 1.5% occasional, 15.3% daily), and 49.2% reported alcohol consumption at least monthly. Regarding chronic conditions, the prevalence of hypertension and diabetes was 36.6% and 16.2%, respectively. Most participants reported an average sleep duration of 7.0–7.9 hours (30.6%) or 6.0–6.9 hours (30.5%). Additionally, 16.5% were classified as having at least mild to moderate depressive symptoms. Regarding oral health, 21.9% of participants reported masticatory discomfort, and 30.8% rated their oral health as poor (Table 1).
Adjusted associations between average sleep duration and both subjective masticatory discomfort and subjective poor oral health. Using 7.0–7.9 hours of sleep as the reference group, a clear U-shaped pattern was observed. Sleep duration <5 hours was significantly associated with a higher likelihood of experiencing masticatory discomfort (AOR=1.377, 95% CI: 1.273–1.491) and poor oral health (AOR=1.322, 95% CI: 1.230–1.420). Similarly, sleep durations of 5.0–5.9 hours and 6.0–6.9 hours also showed elevated odds for both outcomes compared with the reference category. Longer sleep durations demonstrated a comparable pattern.
Participants sleeping ≥9.0 hours had significantly higher odds of reporting masticatory discomfort (AOR=1.245, 95% CI: 1.140–1.360) and poor oral health (AOR=1.278, 95% CI: 1.188–1.383). The model fit statistics indicated acceptable explanatory power (Pseudo R² = 0.1313 for masticatory discomfort; Pseudo R² = 0.0941 for poor oral health) (Table 2). The AMEs of both <5 and ≥9 hours sleep durations were associated with 4.5 and 2.9 percentage-point increases, respectively, in the predicted probability of masticatory difficulty (Table 3).
Subgroup analyses stratified by age group and gender (Table 4) further confirmed this trend. Among adults aged 45–64 years, sleep duration <5 hours was strongly associated with masticatory discomfort (AOR=1.467, 95% CI: 1.284– 1.676) and poor oral health (AOR=1.451, 95% CI: 1.296– 1.625). Similar associations were found in the 65–74-year age group, particularly for poor oral health (AOR=1.224 and 1.180). In adults aged ≥75 years, both <5 and ≥9 hours sleep durations were significantly associated with increased masticatory discomfort (AOR=1.293 and 1.313), whereas poor oral health was markedly higher in those with a sleep duration of ≥9 hours (AOR=1.289, 95% CI: 1.140–1.458). Gender-stratified results showed consistent associations. Among men, sleep durations <5 hours and 5.0–5.9 hours significantly increased odds of masticatory discomfort (AOR=1.503 and 1.312) and poor oral health (AOR=1.369 and 1.291). Women exhibited similar patterns; those sleeping <5 hours had elevated odds for masticatory discomfort (AOR=1.310, 95% CI: 1.186–1.446) and poor oral health (AOR=1.297, 95% CI: 1.184–1.421), with increased risks also observed at ≥9 hours of sleep.
Subgroup analyses according to sociodemographic factors are presented in Tables 5 and 6. Sleep duration <5 hours was consistently associated with higher odds of both subjective masticatory discomfort and poor oral health perception across all depression groups. Among participants with normal depression scores (PHQ-9 0–4), sleeping less than 5 hours was associated with increased odds of masticatory discomfort (AOR = 1.529, 95% CI = 1.372–1.699) and poor oral health (AOR = 1.544, 95% CI = 1.406–1.694) compared with 7.0–7.9 hours of sleep. Similar associations were observed in the mild-to-moderate depression group (PHQ-9 5–14), although effect sizes were slightly smaller. In the moderate-to-severe depression group (PHQ-9 ≥15), both <5 and ≥9 hours sleep durations were associated with higher odds of masticatory discomfort (AOR = 1.611 and 2.310).
When stratified by job type, white-collar and service/sales workers exhibited higher odds of masticatory discomfort and poor oral health than blue-collar workers and unemployed individuals. Among white-collar participants, sleep duration <5 hours was associated with higher odds of masticatory discomfort (AOR = 1.712, 95% CI: 1.239–2.364) and poor oral health (AOR = 1.662, 95% CI: 1.294–2.133). Similar associations were observed among service/sales workers, with AORs of 1.602(95% CI: 1.250–2.052) for masticatory discomfort and 1.413(95% CI: 1.145–1.742) for poor oral health.
Regarding marital status, participants who were never married or divorced showed significant associations. Among the never married, sleeping less than 5 hours was associated with AORs of 1.612 (95% CI: 1.078–2.411) for masticatory discomfort and 1.472 (95% CI: 1.038–2.086) for poor oral health. For divorced participants, the corresponding AORs were 1.640 (95% CI: 1.285–2.093) and 1.495 (95% CI: 1.192–1.875). By residential area, associations were stronger in urban than rural residents; sleeping less than 5 hours was linked to AORs of 1.405 (95% CI: 1.269–1.555) for masticatory discomfort and 1.320 (95% CI: 1.205–1.445) for poor oral health (Table 7).
Discussion
This large-scale, population-based study demonstrated that non-optimal sleep duration, specifically <5 and ≥9 hours, was associated with increased risks of masticatory discomfort and poor oral health, forming a U-shaped pattern. This association was most pronounced among men aged 45–64 years, individuals with moderate-tosevere depression, white-collar or service/sales workers, urban residents, and divorced individuals.
Our study indicated that insufficient sleep duration showed significant associations with increased risks of both masticatory discomfort and poor oral health. These associations may be attributed to physiological, biological, and behavioral pathways. Previous studies have demonstrated that age-related declines in muscle strength and neuromuscular coordination are related to decreased masticatory ability, particularly in older adults [16]. Insufficient sleep has been suggested to interfere with muscle recovery and coordination, which may indirectly contribute to reduced oral functional capacity [17]. Furthermore, insufficient sleep has been associated with systemic inflammation and immune dysregulation, which are implicated in the pathogenesis of periodontal disease and oral discomfort [18]. From a behavioral perspective, individuals with shorter sleep duration are more prone to exhibit poor oral hygiene practices, inconsistent eating habits, and increased consumption of cariogenic foods, all of which are risk factors for deteriorating oral health [19,20]. These unhealthy behaviors may stem from fatigue, diminished motivation for self-care, or disruption of daily routines caused by inadequate sleep [21].
Conversely, excessive sleep duration, frequently associated with underlying chronic disease, depression, or sedentary behavior, may reflect health-related susceptibility that leads to poor oral outcomes [22]. Considering physiological, biological, and behavioral mechanisms, these factors may help explain the U-shaped association observed between sleep duration and oral health outcomes in this study.
Subgroup analyses of individual factors, including age, gender, and depressive symptoms, revealed significant variations. The association between sleeping <5 hours and both masticatory discomfort and poor oral health remained statistically significant across all age groups, with the highest AOR observed among middle-aged adults (45–64 years). This pattern may be related to accumulated lifestyle factors, including heavy workload [23], frequent alcohol consumption [24], and high consumption of sugary foods, which can adversely impact sleep quality and oral health. These findings are consistent with those of previous studies that demonstrated increased vulnerability to sleep disturbances among middle-aged individuals due to cumulative psychosocial stress and physiological decline [25,26]. Regarding gender, short sleep duration had a stronger association with poor oral health and masticatory discomfort in men than in women. This may reflect gender-related differences in oral hygiene behaviors and increased exposure to occupational stress [22,27]. Men are generally reported to engage less in preventive health behaviors and are more prone to experience irregular daily routines [28,29], both of which may exacerbate the consequences of sleep deprivation. Sleep duration was associated with masticatory discomfort and poor oral health, with the strength of this association varying by depression severity. In participants without depressive symptoms, short sleep had the most pronounced negative effect. In the mild-to-moderate depression group, the association was weaker, possibly due to partial offset by intermediate depressive symptoms. Among those with severe depression, both short and long sleep were linked to higher risks, forming a U-shaped pattern. These findings suggest that psychological vulnerability modifies the impact of sleep duration on oral health [30]. Additionally, it aligns with evidence indicating that sleep duration is significantly related to depression [31]. Recent findings from a cross-sectional study on Korean adults demonstrated a positive association between high stress levels and self-reported poor oral health [32]. Loneliness is associated with masticatory discomfort [33]. When these factors coexist with depressive symptoms, which may be worsened by short sleep duration, they may further strengthen the observed negative association between sleep and oral health [34].
Significant discrepancies were detected in the association between sleep duration and dental health when subgroups were analyzed based on residence area, marital status, and job type. Urban residents exhibit a stronger association between sleep deprivation and masticatory discomfort or poor oral health than rural residents. Environmental factors prevalent in urban areas, including noise, air pollution, and irregular lifestyle patterns, may impair sleep quality, thereby contributing to oral health deterioration [35]. Sleep deprivation impairs immune function and exacerbates systemic inflammation, aggravating periodontal inflammation and increasing masticatory discomfort. A previous experimental study has demonstrated that sleep-deprived mice exhibit increased gingival inflammation and alveolar bone loss [36]. These findings suggest that sleep deprivation and fatigue act as modifying factors for periodontal disease progression. A population-based study has demonstrated that individuals with sleep disorders experience more frequent toothache and masticatory discomfort and poorer self-rated oral health [37]. Rural areas may be associated with lower environmental stress and more regular daily routines, perhaps alleviating the adverse effects of sleep deprivation on oral health. Marital status further modified these associations. Divorced individuals with short sleep duration exhibited the highest risks for masticatory discomfort and poor oral health, highlighting the role of social isolation and emotional stress in oral health disparities [22]. Occupational differences were also apparent. White-collar workers who slept <5 hours had significantly higher risks of poor oral health and masticatory discomfort, which may be related to sustained occupational stress and muscle tension that could influence masticatory discomfort [38,39].
Potential confounding factors may exist in the relationship between sleep duration and masticatory discomfort. In this study, after adjusting for a wide range of sociodemographic and behavioral variables, the associations between sleep duration and both masticatory discomfort and poor subjective oral health remained statistically significant. Adjusted odds ratios, AME, and model explanatory power (Pseudo R²) were considered to assess these associations. Furthermore, additional subgroup analyses focusing on potential confounders were conducted to examine possible interactions, and these analyses also supported the observed associations between sleep duration and masticatory discomfort. These findings indicate that sleep duration independently contributes to an increased likelihood of masticatory discomfort and poor oral health, even after controlling for potential confounders. Nevertheless, residual confounding cannot be entirely excluded, as unmeasured factors—such as dietary habits, stress levels, oral hygiene behaviors, systemic inflammation, and genetic predispositions—may still have influenced the observed associations. These factors should be taken into account when interpreting the results.
To the best of our knowledge, epidemiological studies analyzing the association between sleep duration and masticatory discomfort remain limited, particularly those utilizing large-scale population data stratified by age, gender, and depression. Highlighting the essential role of sleep duration in understanding oral health is a substantial and valuable initial step in this field. These findings may also serve as fundamental data for future research on the comprehensive association between sleep duration and oral health and provide a basis for developing targeted interventions to promote better sleep and oral health. Highlighting the essential role of sleep duration in understanding oral health is a substantial and valuable initial step in this field. These findings may also serve as fundamental data for future research on the comprehensive association between sleep duration and oral health and provide a basis for developing targeted interventions to promote better sleep and oral health.
This study has some limitations. First, the cross-sectional design provided valuable insights into associations but did not allow for causal inferences. The temporal association between sleep duration and oral health could not be established, leaving the possibility that poor oral health could affect sleep duration or vice versa. Longitudinal studies are needed to better understand the directionality of these associations and determine whether interventions aimed at improving sleep duration can lead to improved oral health. Second, reliance on selfreported measures for sleep duration and subjective oral health introduces potential recall bias and misclassification. Objective assessments of sleep (e.g., actigraphy or polysomnography) and clinical oral examinations would strengthen future research. Third, although the study accounted for several confounding factors, other unmeasured variables might have affected the observed associations. Uncontrolled factors, including diet, stress, physical activity, and genetic predispositions, might significantly influence the association between sleep duration and oral health. Cultural and environmental factors influencing sleep patterns and oral health behaviors were not accounted for, potentially limiting the generalizability of the findings to diverse populations. Future studies may further clarify the pathways linking sleep duration to masticatory discomfort by employing mediation analyses or structural equation modeling, which could provide a more comprehensive understanding of the underlying mechanisms.
In conclusion, this study demonstrated that insufficient sleep duration is significantly associated with masticatory discomfort and poor oral health among Korean adults. These findings highlight the potential significance of sleep-focused interventions in oral health promotion strategies. The disparity in this association across sociodemographic and psychological factors underscores the need for tailored interventions.


 PDF Links
 PubReader
 ePub Link
 XML Download
 Full text via DOI
 Download Citation
 Print
Print