노인 치과주치의사업 모형 제안에 대한 경기도 치과의사의 견해 조사 연구
A study of Gyeonggi-do dentists’ opinions on the model of registered dentists for the elderly
Article information

Trans Abstract
Purpose
This study aimed to examine Gyeonggi-do dentists’ opinions on the model of registered dentists for the elderly.
Materials and Methods
An online survey was conducted from June to August 2025, among members of the Gyeonggi-do Dental Association. Of the 4,690 members, 392 dentists participated (response rate = 8.4%), and 387 samples were analyzed after excluding 5 responses with inappropriate answers. The questionnaire was constructed with general characteristics, service items, and willingness to participate. Frequency and cross-tabulation were analyzed using IBM SPSS Statistics ver. 26.0 (IBM Corp, Armonk, NY, USA), with significance at α = 0.05.
Results
Half of the respondents were in their 50s and most worked in dental clinics. The perceived needs for every service item were high; oral examination, professional oral hygiene care, and scaling showed the highest necessity within each category. Patient history review and professional oral hygiene care were the greatest necessity in dentists with longer practice experience, whereas preventive service was rated higher by women and those with the least experience (p < 0.05). Most respondents suggested that individuals aged 65 years or older be the best target group, and 87.6% expressed willingness to participate. No significant differences were found in general characteristics for these questions (p > 0.05).
Conclusion
Gyeonggi-do dentists recognized the importance of a preventive-oriented approach and the shift toward long-term care in the model of registered dentists for the elderly. It is necessary to include perspectives from various stakeholders, such as local government officials, to develop feasible strategies for implementation in future studies.
서론
우리나라는 2025년 기준 65세 이상 고령 인구가 전체 인구의 20.0%를 넘는 초고령화 사회에 진입하였고, 2036년에는 30.0%를 돌파할 예정이다[1]. 이러한 초고령화 사회에서 65세 이상 다빈도 상병에 치과 질환이 높은 순위를 차지하고 있고, 노인의 경우 만성질환이 있는 경우 특히 완치가 어렵고, 악화되기 쉽기 때문에 예방과 관리가 매우 중요하며[2], 구강건강 관리에서도 만성질환을 고려한 예방 중심의 복합적인 관리의 중요성이 대두되고 있다[3]. 이와 함께 경상 의료비와 치과 외래진료비도 매년 증가하여, 2023년 기준 각각 221조 원, 13조 원으로 나타났다. 하지만 정부 및 의무가입(건강)보험의 비중에서는 차이를 나타내고 있는데, 경상의료비는 63.2%였으나, 치과 외래진료비의 경우 36.4%로 절반 수준에 불과하다[4]. 이처럼 2000년대부터 치과 부문 보장성 강화를 통해 급여 항목이 늘어났음에도 본인 부담이 여전히 높아, 경제적으로 취약한 노인의 경우 구강건강서비스 이용이 제한될 가능성이 높다[5].
세계보건기구(World Health Organization, WHO)에서는 건강한 노화를 위해 누구나 쉽게 접근할 수 있고 이용할 수 있는 구강건강 정책이 시행되어야 한다고 강조하고 있으며[6], 삶의 질 향상을 위해 노인 통합서비스 제공 지침(Integrated Care for Older People, ICOPE)을 제안하여 고령자의 신체적 정신적 건강을 종합적으로 평가하여 예방과 지속관리 중심의 맞춤형 돌봄 계획을 실천하도록 하고 있다[7-9]. 이에 따라 유럽에서는 고령자의 구강건강 관리의 문제점을 지적하며 교육 및 정책, 사회적 참여를 통합한 다양한 전략이 필요하다고 권고하였으며 일본에서는 이미 지역포괄케어 서비스의 확대를 통해 치과의 역할이 의료 중심에서 커뮤니티 중심 통합케어 모델로 전환 되어 예방, 구강기능 유지, 방문 치과진료, 생활기능 지원의 역할이 증가하는 중이다[10,11].
우리나라도 이러한 시대적 흐름에 따라 노인들 간의 구강건강 격차를 줄이면서 전체적인 구강건강을 개선할 수 있는 보편적인 서비스 제공이 필요하다. 현재 우리나라의 구강보건체계는 치료 중심의 접근 방식에 머물러 있고, 노인을 위한 예방 중심의 지속 관리는 전무한 실정이다[2]. 이에 단기적 치료 서비스가 아닌, 장기적 관리와 예방 중심의 일차 치과의료 서비스 제공[12]을 위한 치과주치의 제도 도입이 필요하다[13]. 현재 치과주치의 제도는 아동과 장애인을 대상으로 시행되고 있어 고령화 시대에 맞게 노인을 위한 노인치과주치의 제도도 확대시행 되어야 한다[14,15]. 이를 통해 노인의 구강건강을 유지하고, 진료비 부담을 줄일 수 있는 보편적인 예방 서비스의 적용이 가능해질 수 있다[16].
연구팀에서는 등록을 통해 연 2회 정기적으로 치과를 방문하여 복합적인 관리를 받을 수 있는 노인치과주치의 사업 모형을 개발하였다. 이에 사업의 실질적 적용과 성공적 안착을 위해 서비스 제공자의 견해를 조사하고, 이를 바탕으로 기존의 치과주치의 제도의 개선방안을 모색함으로써, 일차의료체계의 중심인 치과의사의 관점이 반영된 사업 모형을 재구성하고자 하였다[17].
따라서 본 연구는 노인치과주치의 모형에 대한 치과의사의 견해를 조사하여 모형의 성공적인 안착을 위한 기초 자료로 사용하고자 한다.
대상 및 방법
본 연구는 경기도 치과의사회 회원 4,690명 중 설문 참여에 동의한 392명을 대상으로 진행하였다(응답률 8.4%). 이 중 응답 부적절, 입력 오류 등의 5명을 제외하고 최종 387명의 자료를 분석하였다. 대상자의 윤리적 보호를 위해 설문 참여 전 연구의 목적과 방법 등을 제시하여 동의 받은 후 시행하였다. 본 연구는 경기도 치과의사회에서 시행한 설문 결과를 경희대 연구진이 전달받아 분석을 시행하였고, 자료 분석에 대해 경희대학교 치과대학 생명윤리위원회의 심의를 받아 진행하였다(KHSIRB-25-051(EA)).
설문조사는 노인치과주치의 사업 모형에 대한 의견을 파악하기 위해 단면조사로 시행하였다. 조사대상자는 경기도 치과의사회 전체 회원을 모집단이자 표본으로 하여 대상자 모두에게 구글 설문 URL이 포함된 문자를 발송하였다. 발송된 문자를 받은 대상자 중 설문조사 참여에 동의한 경우에만 응답자로 분류되었다. 응답자는 모바일 기기 또는 개인용 컴퓨터를 이용하여 설문에 응답할 수 있었으며, 설문 응답은 개인식별이 불가능한 무기명 방식으로 수집되었다. 설문 기간은 2025년 6월부터 2개월간 진행하였으며 설문 내용은 연구 대상자의 일반적인 사항, 즉 성별(sex), 나이(age), 치과 병·의원 구분(type of institution), 소재지(4개 권역)(region), 치과 개원경력(years of practice) 및 규모(clinic size) 등과 노인치과주치의 사업에 대한 의견(서비스 항목별 필요도, 대상자 연령, 치과의사의 사업 참여 여부)로 구분하여 세부문항을 구성하였다.
분석은 일반적인 특성은 빈도분석(frequency analysis)으로, 일반적 특성에 따른 노인치과주치의 사업에 대한 의견, 즉 서비스 항목별 필요도, 대상자 연령, 치과의사의 사업 참여 여부는 교차분석(Chi-square test)으로 진행하였다. 모든 분석은 IBM SPSS Statistics ver. 26.0 (IBM Corp, Armonk, NY, USA) 프로그램을 사용하였으며, 통계적 유의성 검정은 α=0.05로 설정하였다.
결과
대상자의 일반적 특성
전체 응답자 387명 중 남자가 여자보다 약 3.5배 많았고, 연령대는 50대(44.7%)가 가장 많았으며, 다음으로 40대, 60대 이상 순이었다(Table 1). 성별로 보면, 남자는 50대(45.2%)가 가장 많았고, 여자는 40대 이하(45.3%)가 가장 많았고 통계적으로 유의하였다(p = 0.026). 병・의원 구분에서는 치과의원(dental clinic) 근무자가 대부분(98.2%)을 차지하였고 성별에 따라서도 동일하였다. 지역별로는 중부권(central region) (43.7%)이 가장 많았고, 다음으로 동부권(eastern region), 북부권(northern region), 남부권(southern region) 순이었다. 남녀 모두에서도 중부권이 많았다. 개원경력은 20년 이상(50.4%)이 가장 많았고 남녀 모두에서도 같은 결과를 보였으며, 그 다음으로 10~20년 미만, 10년 미만 순으로 나타났으며 통계적으로 유의하였다(p < 0.001). 치과규모 중 유니트체어 수는 4대(29.5%)가 가장 많았으며, 남녀 모두에서도 동일하게 높은 비율을 보였으며, 다음으로 3대 이하, 5대 순으로 나타났다. 치과의사 수는 1명(72.0%)인 경우가 가장 많았고, 성별로도 같은 결과를 보였으며 이는 통계적으로 유의하였다(p= 0.015). 치과위생사는 1명(22.6%), 5명 이상(21.5%) 순으로 분포하였는데 성별로는 남녀 모두에서 같은 결과를 보였다. 마지막으로 간호조무사 등 기타 인력은 2명(29.3%)인 경우가 가장 많았으며 남녀 모두 기타 인력이 2명인 경우가 많았다. 반면, 병·의원 구분, 지역, 유니트체어 수, 치과위생사 수, 기타 인력에서는 성별에 따른 통계적으로 유의한 차이가 나타나지 않았다(p > 0.05).
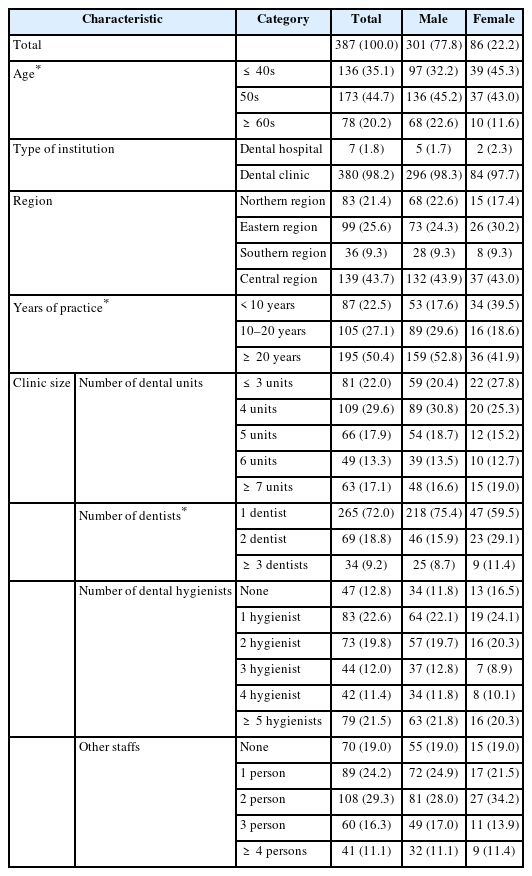
General characteristics of the study participants [number (%)]
대상자의 일반적 특성에 따른 노인치과주치의 사업에 대한 의견
서비스 항목별 필요도 조사에서 구강검진 항목(oral examination items)에서는 구강검사(oral examination)(99.0%), 구강위생검사(oral hygiene assessment)(97.9%), 문진표분석(questionnaire analysis)(95.1%) 순으로 나타났고, 예방 항목(preventive care items)에서는 전문가 구강위생관리(professional oral hygiene management)(97.7%), 칫솔질교육(toothbrushing instruction)(96.1%), 예방서비스(preventive service)(81.4%) 순으로, 선택 항목(optional treatment items)은 치석제거(scaling)(98.7%), 방사선사진 촬영(x-ray taking)(98.2%) 순으로 나타났다(Table 2, Fig. 1). 일반적 특성에 따른 서비스 항목별 필요도를 분석한 결과 구강검진 항목 중 문진표 분석이 ‘필요’하다는 응답이 개원경력에 따라 다르게 나타났는데, 20년 이상(97.4%)에서 가장 높게 나타났고, 그 다음으로 10년 미만, 10-20년 미만 순으로 나타났다(p = 0.029). 예방 항목의 예방서비스의 경우, ‘필요’ 응답 비율이 여성(89.5%)이 남성(79.1%)보다 유의하게 높게 나타났으며(p = 0.028), 개원경력에 따라 10년 미만(90.8%)에서 ‘필요’ 응답 비율이 가장 높았으며, 그 다음으로 20년 이상(79.0%), 10–20년 미만(78.1%) 순으로 나타났다(p = 0.037). 마지막으로 예방 항목 중 전문가 구강위생관리의 경우에서 ‘필요’ 응답 비율이 개원경력에 따라 20년 이상(99.0%)에서 가장 높았고, 그 다음으로 10년 미만(98.9%), 10–20년 미만(94.3%) 순으로 나타나 통계적으로 유의한 차이를 보였다(p = 0.026). 이외의 항목에서는 통계적으로 유의수준의 차이는 나타나지 않았다(p > 0.05).

Necessity of oral health service items by general characteristics [number (%)]
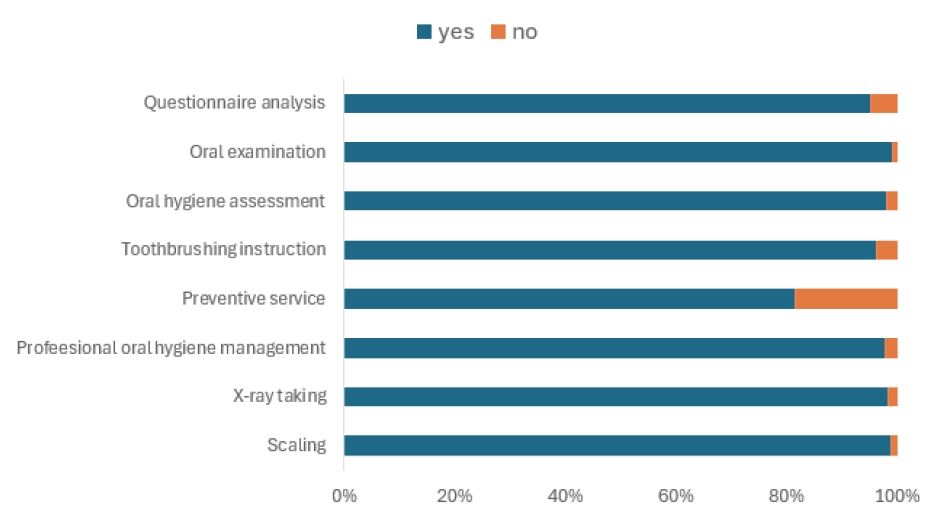
Dentists’ perceptions of the necessity of individual oral health service components in the registered dentist program for older adults in Gyeonggi Province
대상자의 적정 연령(target age group)으로는 65세 이상(58.1%), 치과의사의 사업 참여 여부(willingness to participate)에 관한 질문에는 ‘참여(87.6%)’하겠다는 응답이 가장 많았다(Table 3, Fig. 2). 다만, 일반적 특성에 따른 대상자의 적정 연령, 치과의사의 사업 참여 여부를 분석한 결과에서는 통계적으로 유의수준의 차이는 나타나지 않았다(p > 0.05).
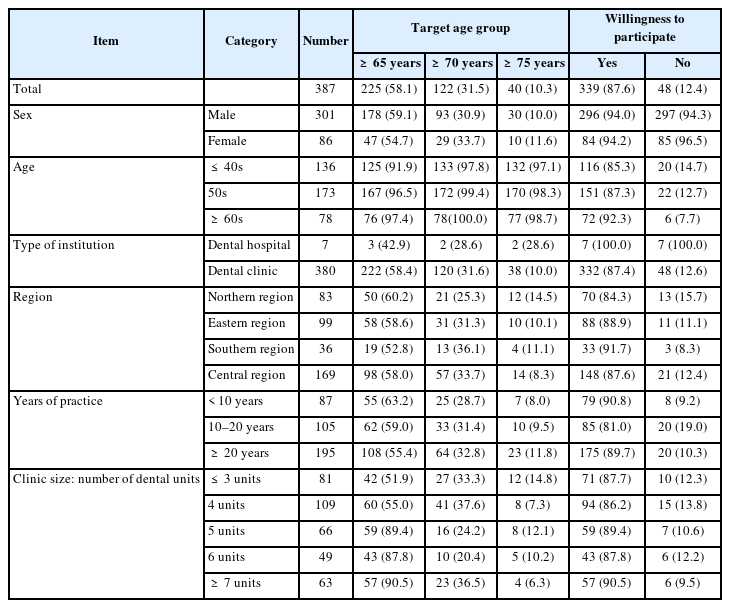
General characteristics and overall perceptions of the elderly dental care program [number (%)]
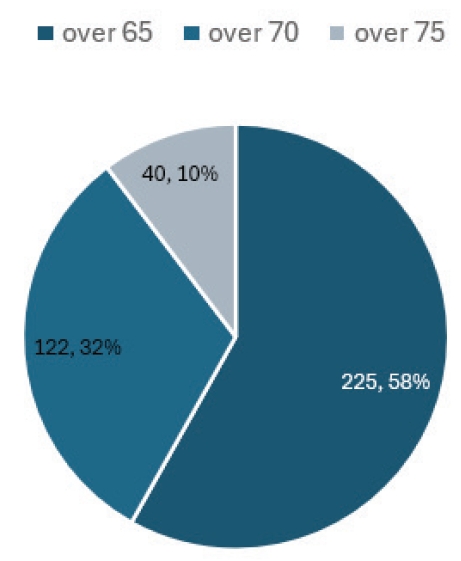
Dentists’ opinions on the appropriate target age for the registered dentist program for older adults in Gyeonggi Province.

Dentists’ willingness to participate in the registered dentist program for older adults in Gyeonggi Province.
고찰
고령화 사회에 진입함에 따라 65세 이상 인구의 만성질환 및 치과 관련 질환이 늘어나고 있으며, 이에 따른 의료비 부담 또한 지속적으로 확대되고 있다. 이러한 상황에서 노인을 대상으로 한 포괄적인 구강관리 서비스의 개발이 필수적이다. 이에 본 연구는 노인치과주치의 제도의 서비스 모형을 제시하여 이에 대한 치과의사의 견해를 조사함으로써 모형의 성공적 안착을 위한 기초자료 마련을 위해 수행되었다.
서비스 항목별 분석 결과, 모든 항목에서 전반적으로 매우 높은 필요도를 보였다. 특히, 구강검진 항목 중 구강검사, 예방항목 중 전문가 구강위생관리, 선택 항목에서는 치석제거가 높게 나타났는데 이는 이전 아동 치과주치의 관련 견해조사 연구에서도 유사한 결과를 나타낸 바 있다[18]. 이 항목들은 임상 현장에서 예방중심으로 서비스를 제공하여 대상자에게 효과를 나타낼 수 있는 항목들로 판단된다. 특히, 예방 항목 중 전문가 구강위생관리는 중증 환자나 장기요양시설 노인들을 대상으로 한 연구에서도 이미 그 효과가 입증된 바 있다[19,20]. 일본에서는 예방의 중요성을 인식하여 이미 고령층을 대상으로 한 지역포괄케어 시스템 내에서 치과를 예방 및 기능유지, 장기요양 연계 서비스의 핵심 주체로 규정하고 있다[11]. 본 연구에서 예방중심 서비스의 필요도가 높게 나타난 것으로 보아 일본과 정책 방향이 공통적으로 예방을 지향한다는 것은 일치하나, 일본에서는 이미 제도적으로 시행되고 있는 점과 차이를 보인다. 이와 같은 예방 중심 서비스의 제공은 구강건강을 지속적으로 증진시키는 데 기여하며, 이러한 경험은 환자의 높은 만족도 향상으로 이어질 수 있다고 보여진다[21].
일반적 특성별 필요도 분석에서 구강검진 항목 중 문진표 분석은 개원경력이 20년 이상인 집단에서 가장 높게 나타났는데, 이는 임상 경험이 많을수록 노인 환자에 대한 이해도가 높아 종합적인 문진 정보의 중요성을 인지하고 있기 때문이라고 여겨진다[22]. 또 예방 항목 중 예방서비스의 경우 여성 치과의사와 개원 경력이 짧은 집단에서 필요성을 더 높게 인식한 점은 이전 연구들에서 여성 및 젊은 세대 의료인의 경우 상대적으로 환자 중심의 예방지향적 진료 태도를 보인다는 분석결과와 유사하다[23]. 전문가 구강위생관리 항목에서도 20년 이상 경력 집단에서 높게 나와 풍부한 임상경력과 환자에 대한 높은 이해도, 특히 노인의 경우 포괄적이고 계속적인 구강관리의 중요함을 인지하고 있기 때문으로 보인다[24].
한편, 사업의 적정 대상자 연령으로 65세 이상이 가장 많이 제시된 것은, 우리나라 노인복지법에 따라 65세 이상을 노인의 법적 기준 연령으로 명시[25]하고 있어 대다수의 노인 대상 공공보건사업이 동일한 연령을 기준으로 적용[26]하고 있기 때문으로 해석된다. 또한, 응답한 치과의사의 노인치과주치의 사업에 대한 참여 의향이 높아 긍정적인 의견을 확인할 수 있었다. 이러한 경향은 앞서 시행된 아동 치과주치의 시범사업에서도 유사하게 나타났다[27]. 사업이 진행되면서 치과의사의 참여율도 증가하였고[28], 이는 치과주치의 제도가 대상의 연령이나 상황에 관계없이 국민의 구강건강 증진에 대한 사회적 책임 의식과 공공의료에 대한 공통된 취지를 바탕으로 일정 수준의 수용성과 효과성을 가지는 서비스임을 시사한다. 한편, 위의 항목에 대한 일반적 특성에 따른 차이는 통계적으로 유의하지 않았는데, 이는 전반적으로 응답자들이 유사한 인식과 의견을 공유하고 있었음을 의미한다고 볼 수 있다.
본 연구는 대한치과의사협회 내 회원수가 큰 규모의 지역을 선정하여 설문조사를 시행하였으나, 표본 자체가 특정 지역 치과의사회를 중심으로 진행하였기에 전체 치과의사를 대표하기에는 한계가 있을 수 있다[29]. 또한 실제 사업이 시행되고 있는 시점이 아닌, 사업 모형을 구축하는 과정에서 모형에 대한 의견을 문의한 인식 기반 조사로서, 실제 사업 진행 과정에서 나타날 수 있는 행동보다는 설정된 모형에 대한 응답자의 태도를 반영하고 있다. 이에 실제 사업 진행 시의 행동과 설정된 모형에 대한 태도 간에는 차이가 존재할 수 있지만, 이러한 점이 충분히 반영되지 못한다는 한계를 가진다[30]. 사업이 시행되기 전 사업에 대한 의견수렴을 위해 서비스 항목에 대한 견해를 중심으로 설문조사를 진행하다 보니, 실제로 사업 진행 과정에서 주요하게 다루어질 수가 분석 및 의견, 추진체계 등의 거버넌스 연계 단체 등을 포함한 사업 전반에 대한 분석과 사업 진행 후에 평가에서 주요하게 다루어질 정량적 분석은 포함되지 못했다. 이는 이후 사업의 시행이 결정된 이후에 진행되어야 할 과제로 여타의 지침에서도 강조하고 있으며[31,32,33], 앞으로 연구진들이 대한치과의사협회나 치과의사회에게 지속적으로 요구해야 하는 과제이기도 하다.
이번 연구는 노인치과주치의 제도 도입과 관련하여, 실제 치과에서 이를 수행할 치과의사의 의견을 통해 서비스 항목별 우선순위와 제도 수용성을 확인하였다는 점에서 의의가 있다. 향후 연구에서는 지역별 특성과 치과의료 인프라 수준을 고려한 다지역 표본을 확보하여 결과의 일반화 가능성을 검증할 필요가 있다. 또한 치과의사뿐만 아니라 지자체, 장기요양기관, 방문구강관리 인력, 서비스 수혜 노인 등 다양한 주체를 포함하여 사업 실행 과정과 제도 연계의 현실성을 종합적으로 검토하는 후속 연구가 요구된다. 아울러 실제 시범사업을 통해 서비스 제공 과정, 수용도, 운영상 쟁점, 정책적 지속가능성 등을 평가하는 연구가 병행되어야 할 것이다.
Notes
Conflicts of Interest
None